Asset: SOL/USDT (Perpetual Futures) Timeframe: 15-Minute Result: +1.5 R (Winner)
There is a specific feeling in the market after a crash. Everyone is confused about what is next? Will it immediately recover, leaving me feeling like a dummy if I don’t go long? Is this just a pause before it crashes even more? Usually, what happens is at least some sideways drift.
If you look at the left side of the chart below, you’ll see the moment. Solana dumped hard, creating panic. So did basically the entire crypto market. Anyone who was holding a long trade with leverage was likely liquidated. In my younger years, I would have tried to trade that noise—desperately shorting the bottom or trying to catch the knife on the way down. Oh, how many times I have tried to catch it on the way down.
But the “Drift” is about patience. It’s about waiting for the market to show its hand.
Yesterday, I stayed on the sidelines during the chaos. I waited for the volatility to settle into a rhythm. That rhythm appeared in the form of a classic Bollinger Band Mean Reversion setup.
The Setup
After a massive breakdown, markets rarely V-shape recover immediately. They tend to grind sideways as buyers and sellers fight for equilibrium. This is where the Bollinger Bands become my favorite tool. They visualize the “elasticity” of price.
The Theory: Think of price like a rubber band. If you stretch it too far away from the average (the middle line), it eventually has to snap back.
The Execution
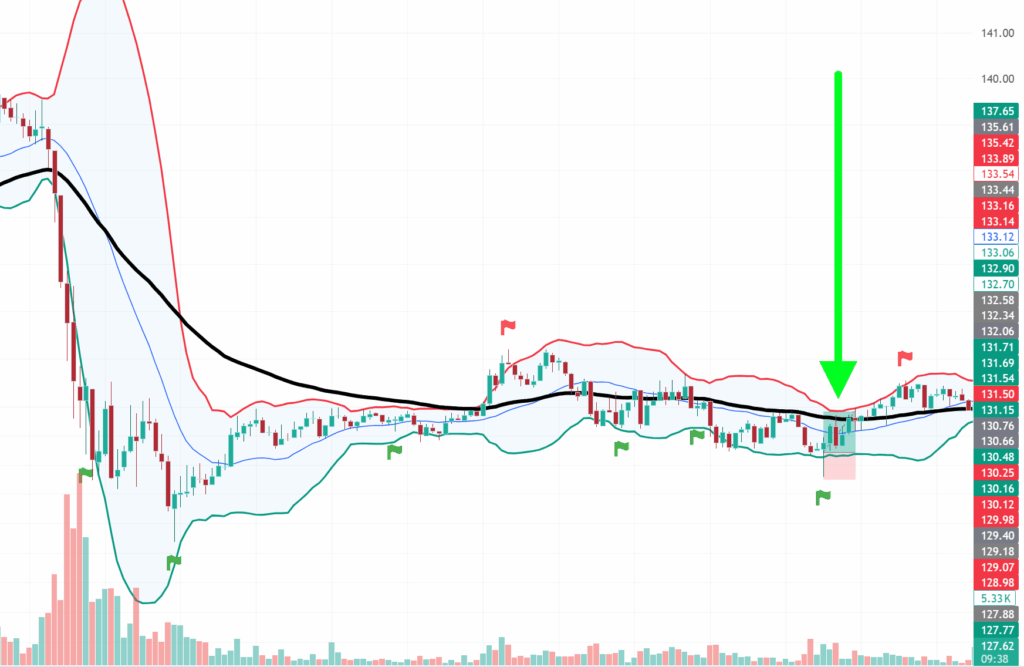
1. The Signal: Around 16:30 EST, SOL had been grinding sideways. Suddenly, price dipped aggressively below the lower green Bollinger Band. This was the “stretch.” The market was momentarily overextended to the downside, but the volume didn’t support a continuation of the crash. See that green wick below the Bollinger Band, right above the little green flag.
2. The Trigger: I didn’t buy the drop. I waited for the reclamation. As soon as price pushed back up inside the band, confirming that the “floor” held, I entered.
- Entry: ~132.06 (Long)
- Stop Loss: ~131.50 (Just below the recent wick—invalidating the thesis if we drop lower).
- Target: ~132.90 (Back toward the mean/upper resistance).
The Result
The trade played out cleanly. No stress, no staring at the 1-minute chart. The rubber band snapped back, price drifted up to the middle of the range, and my Take Profit was hit.
The Takeaway
This wasn’t a “home run” trade. I didn’t retire on this one candle. But it was a process win. Note – by waiting for price to go back up before entering, I left some profit on the table. But that’s ok. Look again to the left side of that image. See that red candle – just as the big drop starts. It has a long wick stretching below the green Bollinger Band. But it didn’t reverse. If I had went long there, thinking “hey, we are below the Bollinger Bands, time for a long trade” I would have been stopped out immediately. It just kept falling. Instead, I waited until things calmed down, and entered a trade only after I saw price moving the way I needed it to.
I used a simple, repeatable mechanical edge (Bollinger deviation) to extract capital from the market’s inefficiency. Then, I closed the laptop.
That is the goal of ChartDrifter: simple setups, clear execution, and the freedom to walk away.
The Fine Print: I am a consultant, but I am not your financial advisor. The content on ChartDrifter is a personal log of my strategies and is strictly for educational and entertainment purposes. I am sharing what I do with my capital, which matches my specific risk tolerance. Cryptocurrency markets are highly volatile. Never trade with money you cannot afford to lose, and always perform your own due diligence before pushing a button.