Multi-Time Frame Analysis
In the neon-lit trenches of the crypto grid, time is the ultimate variable. It distorts, it compresses, and if you aren’t paying attention, it will flatline your portfolio. Price action may be fractal – it looks the same regardless of the timeframe you are trading – but that doesn’t mean it isn’t important
You can have the best indicators, the sharpest algos, and a flawless read on price action, but if you are operating on the wrong temporal frequency, you’re just gambling in the dark. Today, we’re slicing into the anatomy of time frames: how to use the High Time Frame (HTF) to map the macro environment, and the Low Time Frame (LTF) to execute with surgical precision.
The Macro View: Respecting the HTF
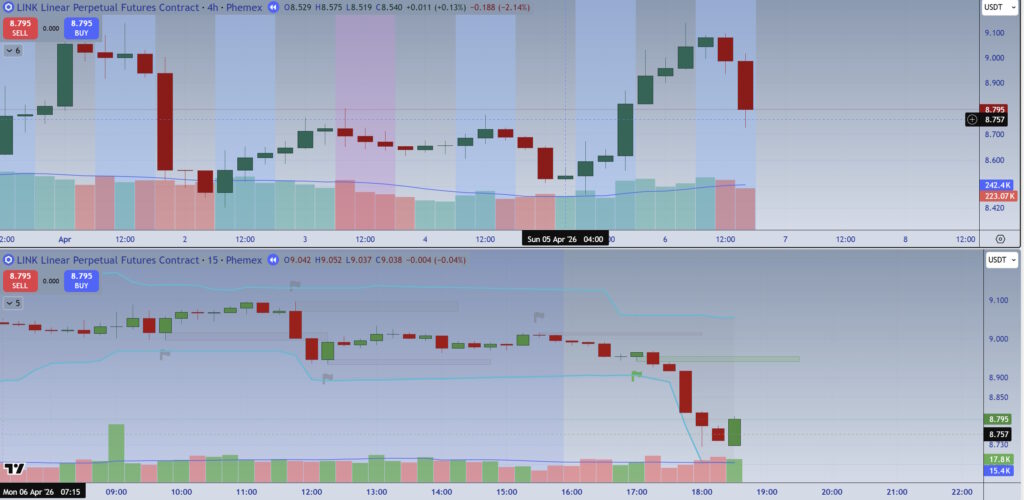
Think of the High Time Frame (Daily, 4H, 1H) as the overall weather system of the market. It cuts through the noise and the algorithmic chop to show you the true direction of the data stream.
Looking up at the HTF can save you a world of hurt. Imagine this: your LTF strategy and indicators are screaming for a long trade. The setup looks perfect. But when you zoom out to the 4H chart, you see the grim reality—you are dead in the middle of a brutal, structural downtrend.
Can you still take the long? Maybe. It could be the start of a reversal, or a local pullback you can scalp. But by checking the HTF, you immediately know you are trading counter-trend. You are increasing your risk, and you need to adjust your sizing and targets accordingly. The HTF is your reality check.
The Micro View: Speed of Execution on the LTF
Here is where we put the “multi” in “Multi-Time Frame analysis.” While the HTF tells you what to do (e.g., “look for shorts”), the Low Time Frame (15m, 5m, 1m) tells you exactly when to do it. The LTF is all about speed of execution and minimizing your stop-loss distance. It’s where you find your entry triggers and optimize your risk-to-reward ratio. I remember one day looking at my trades for the week and thinking – this was a good week, a winning week. Yet, I was late on every single trade. I entered exactly when my 15 minute strategy signaled the entry – but when I applied the same indicators – with some tweaks – to the 5 minute chart, a whole different regime opened up.
The Chart Drifter Protocol: The 15m/5m Sync
Strategy is always evolving, but my current refinement in the grid relies on a two-tiered temporal setup: trading the structure of the 15-minute candle, while using the 5-minute candle as an early warning system.
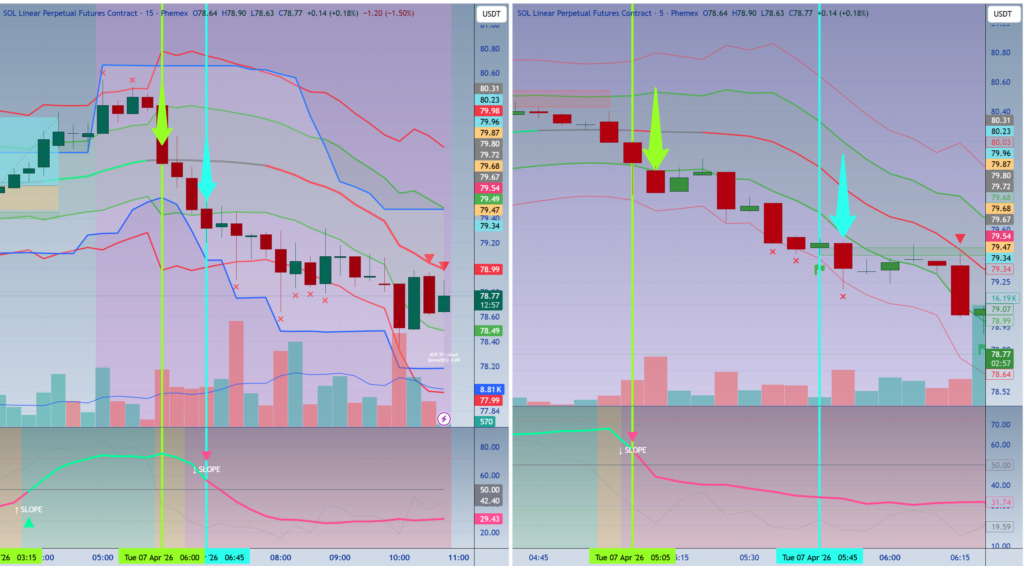
Consider the chart above. On the left, my 15 minute chart, with an indicator at the bottom. The right – exactly the same, but with the indicator set to only alert when extreme conditions shown, because the right pane is showing 5 minute candles, notoriously subject to noise. Now, on the 15 minute chart – you see the blue vertical line and the blue arrow. This is how my traditional entry would work – get in here, set Stop Loss and Take Profit. But instead – I drop down to the 5 minute – and look how much earlier the same indicator fires, shown with the green vertical line and the green arrow. Wouldn’t you rather enter the short at the green arrow? The move ends up being much longer, and you are close to the structural level for Stop Loss placement, meaning the SL is tighter.
Both trades are profitable, but if, with a simple extra step, you can ramp up your profits, why wouldn’t you?
Here is how the protocol executes:
- The Anchor (15m): The trade is largely structured, analyzed, and managed on the 15m chart. This time frame filters out the most chaotic micro-noise while still providing enough intraday setups.
- The Tripwire (5m): An alert is set for the 5m chart. If I get a solid, undeniable trigger on the 5m that aligns with my 15m bias, I execute.
Why not wait for the 15m to close? Because in volatile markets, waiting for that 15m confirmation can cost you the best part of the move. By stepping down to the 5m for the entry, I get a faster, safer, and ultimately more profitable entry price. My stop loss can be tighter, which skews the risk/reward metric heavily in my favor. It’s about letting the 15m dictate the war, but letting the 5m dictate the battle.
Choose Your Temporal Class
The exact flavor of Multi-Time Frame analysis will depend on what type of a trader you are. Your chosen time frame dictates your entire trading lifestyle. Where do you fit in the grid?
- Scalping (Seconds to Minutes): High-frequency trench warfare. Scalpers live in the 1m and tick charts, fighting for fractions of a percent. It requires intense focus, zero hesitation, and screen-time dedication. You are dodging bullets in the data stream.
- Day-Trading (Minutes to Hours): The standard operative. Day traders might use the 15m/5m combo to catch intraday swings. The golden rule? No overnight exposure. You close all positions before logging off, sleeping soundly without worrying about a 3:00 AM market crash.
- Swing Trading (Days to Weeks): Riding the larger waves. Swing traders use the 4H and Daily charts to catch structural moves. It requires more patience and wider stop losses, but frees you from staring at the terminal all day.
- Investing (Months to Years): Macro-level accumulation. This is about deep cold storage and long-term thesis plays. Investors ignore the daily noise entirely, focusing on weekly and monthly charts, market cycles, and fundamental shifts.
To survive the drift, you have to master time. Sync your LTF entries with your HTF trends, set your LTF tripwires, and never trade blindly against the macro current.
This applies to retests too. Look again at the 5m chart above – the price moves up right after the entry candle. If instead I had waited for the retest, and set a stop entry as price moved down past my originally indicated price, I could have placed my Stop Loss even tighter. Achieving higher profits without increasing risk seems like a good idea to me.
We can’t see the future, and so far there is no evidence of time machines (for a fun read – check out the story of Stephen Hawking’s time travel party) , so we can’t use real time travel in our trading. But we can still use ‘time’ to boost our profits.
— M