
In my post on the Kelly Criterion, I gave you a formula to calculate the optimal bet size. It’s a beautiful piece of math. It tells you exactly how much to risk to maximize growth.
But there is a flaw in the formula.
The Kelly Criterion assumes you have an infinite bankroll and infinite time to play it out. You have neither. You have a mortgage, a finite amount of capital, and a nervous system that will shut down if you lose 40% of your net worth in a week.
Knowing your “edge” (Win Rate + Reward-to-Risk) is only half the battle. That data comes from Backtesting—looking at what did happen.
But we don’t trade in the past. We trade in the future. And the future is not a single straight line; it is a probability cloud.
The Multiverse of Money
To see the future, I use a Monte Carlo Simulation.
If you are a Marvel fan, think of Doctor Strange in Infinity War. He looked forward in time to view 14,000,605 possible futures. In most of them, they lost. He was looking for the one path where they won.
In trading, we do something similar. I look at 1,000 possible outcomes, not looking for the best one – but the most ordinary. And sometimes the worst one possible.
How It Works
I built a simple simulator in Excel (I am a consultant, after all; Excel is my native language).
I feed it three inputs from my trading journal:
- Win Rate: (e.g., 55%)
- Risk/Reward: (e.g., 1.5R)
- Bet Size: (e.g., 2% of account)
Then, the simulation “trades” a hypothetical year. It flips a weighted coin 500 times.
- Heads (55% chance): I make 3%.
- Tails (45% chance): I lose 2%.
Then it does it again. And again. It runs this “year” 1,000 times.
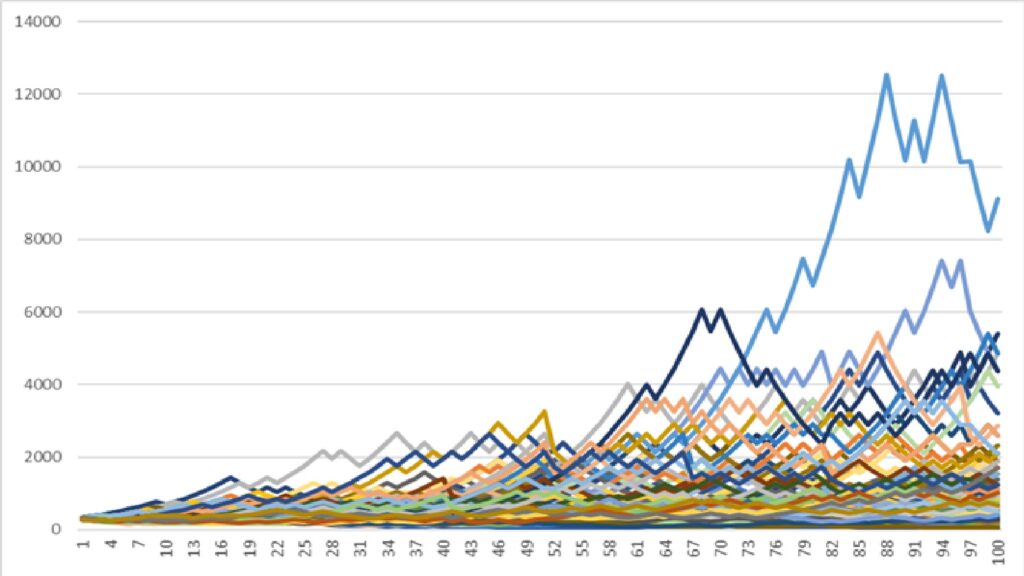
The Mountain Chart
The result looks like an abstract impressionist drawing a series of mountains.
The temptation is to see how high some of the lines go. But some of the lines stay near the bottom. Some might even go below the starting point. Way below.
That is the Sequence of Returns Risk.
You can have a winning strategy and still go broke. If you flip a coin, you know it will be 50/50 eventually. But you could easily flip 10 tails in a row right at the start.
If you are betting aggressive “Full Kelly” sizing (say, 15% per trade) and you hit that “10 Tails” sequence in Week 1:
- Trade 1: -15%
- Trade 2: -15%
- Trade 3: -15%…
By the time the “law of averages” shows up to save you, you are already dead. You hit the Absorbing Barrier.
Why I Run the Simulation
I don’t look at the top line (the scenario where I buy a private island). That is a vanity metric. I look at the Ruin Rate.
If 5% of the simulations end in zero, that is too high. A 5% risk of ruin means that in 1 out of 20 parallel universes, I am explaining to my wife why we have to sell the house.
I am not willing to live in that universe.
Note that it is easy to think that you can never go completely broke risking 40%, if that is full Kelly on your strategy. Each losing trade knocks you down 40%. So you never get down to 0%, you just keep getting smaller. Two problems with this thinking. First – five losses of 40% is going to mean you down almost 99%, so that will feel like you went completely broke.
Second – you would likely be using leverage. If you have any slippage at all, you are going all the way to zero.
The Fix: Quarter Kelly
This is why I advocate for Fractional Kelly (usually Quarter Kelly). When I lower my bet size in the simulation from 15% to 4%:
- The “Private Island” lines at the top come down. (I get rich slower).
- But the “Bankruptcy” lines disappear entirely.
The Monte Carlo simulation proves mathematically what we know intuitively: Survival is the only strategy.
You don’t need to make the most money possible. You just need to make sure you stay in the game long enough for the math to work.
Don’t trade the past. Simulate the future. And if you see a timeline where you die? Change your bet size until that timeline vanishes.
The Fine Print I am a consultant, but I am not your financial advisor. The content on ChartDrifter is a personal log of my strategies and is strictly for educational and entertainment purposes. Past performance (and simulated future performance) is not indicative of future results.