If you opened a textbook on technical analysis written in 1995, you would find patterns with dignified names. The “Head and Shoulders.” The “Cup and Handle.” The “Ascending Triangle.” And for the most part, those are what are still used – nice, respectful, dignified names.
Crypto does not have dignity. It has “The Bart.”
(No, I didn’t name the pattern. I didn’t make this up for clicks. This is actually what people call it. Really!)
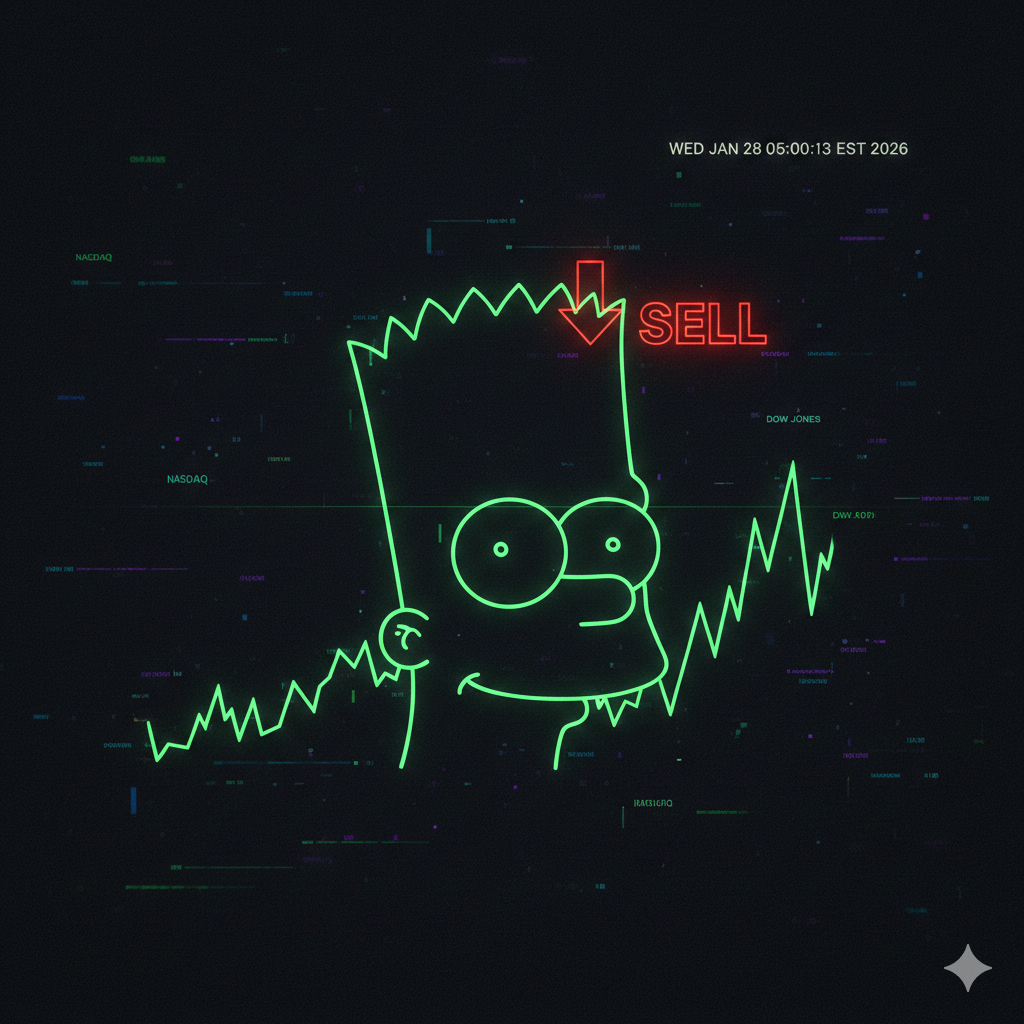
I traded one this morning on SOL. It is one of the most potentially profitable, yet dangerous, patterns in our market. It looks exactly like the head of a certain yellow cartoon character:
- The Left Ear: A violent, vertical pump.
- The Hair: A period of jagged, sideways chop.
- The Right Ear: A violent, vertical dump back to the start.
The Mechanics of the Haircut
Why does this happen? It isn’t random. It is a liquidity trap.
The “Bart” usually appears when a massive order (or a liquidation cascade) spikes the price up into a vacuum. The price moves so fast that it leaves “thin” order books behind it.
Once it hits a ceiling, it stops. This is the top of the head. Now, the algorithms go to work.
The “Hair” (that jagged sideways movement) is not just noise. It is Distribution. Big players are selling their bags to retail traders who are chasing the green candle. The price wicks up and down, hunting for liquidity. It triggers the stop losses of the early shorters (wick up) and the breakout buyers (wick down).
It is a meat grinder.
How I Trade It: The Supply Zone
Most traders see that vertical green line and think, “Bull Flag! It’s going higher!” And often, they are right. That is why the Bart is dangerous. It looks exactly like a pause before a trend continuation.
But here is my filter: The Retest of Supply.
I treat the top of the “Left Ear” as a Supply Zone (a pool of liquidity). When I see the price stalling, I don’t short immediately. I wait for the Retests.
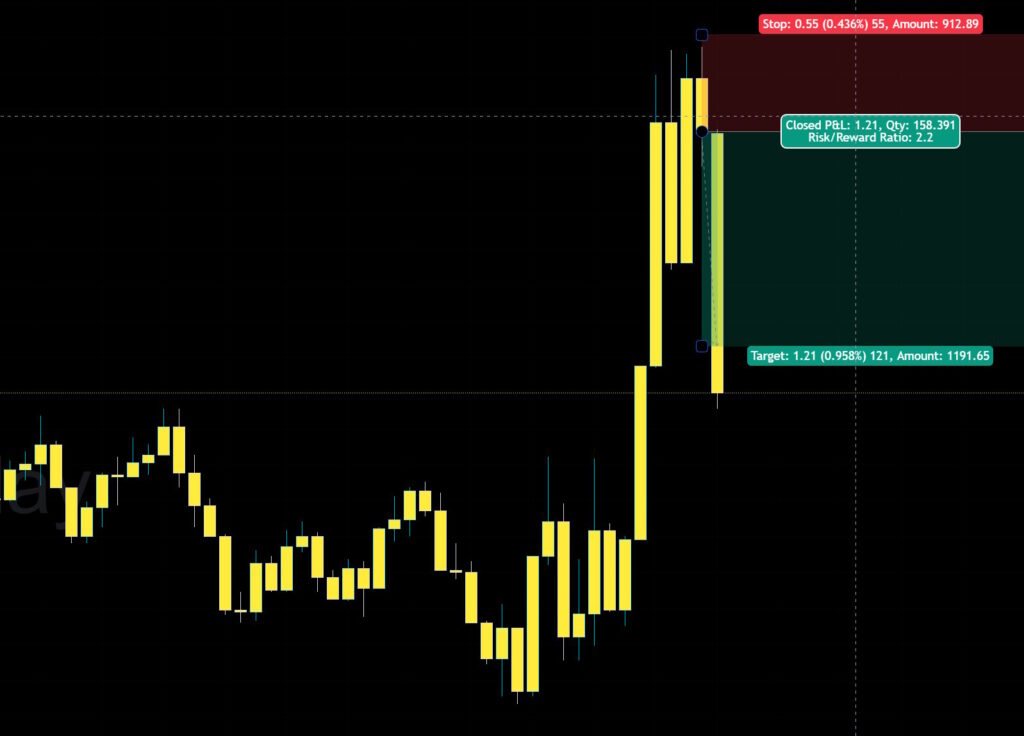
In the SOL chart above, look at the consolidation. It didn’t just sit there. It poked its head up multiple times.
- Attempt 1: Rejection.
- Attempt 2: Rejection.
- Attempt 3: Rejection.
Each time it tried to break higher, it got slapped down. This tells me the buyers are exhausted and the sellers are absorbing the liquidity.
The “Eat My Shorts” Strategy
(Yeah, I went there. I couldn’t resist.)
If you try to short a Bart, you have to respect the danger. If this is a Bull Flag and you are wrong, the “continuation” move will rip your face off.
Here is my protocol for the Bart:
- Wait for the Hair: Never short the initial pump. You have no idea where the top is.
- Identify the Ceiling: Draw a line at the top of the first rejection. That is your “Line in the Sand.”
- Short the Weakness: I look to enter on the 2nd or 3rd failed attempt to break that ceiling. And I enter just below the bottom close of the “hair” candles.
- Dial Back the Risk: As detailed in my post on the Kelly Criterion, I never trade “Full Kelly.” I respect the Absorbing Barrier too much, so my standard size is “Quarter Kelly.” But because the Bart pattern mimics a bullish continuation so closely, I cut that in half again. I trade this at Eighth Kelly.
- Tight Stop: My stop loss goes just above the “Hair.” If price breaks that ceiling with conviction, the Bart is invalidated, and I want to be out immediately.
The Drop
Once the distribution is done, the floor falls out. Because the order book is “thin” from the rapid rise up, there is very little support on the way down. The price elevator drops straight back to the basement.
That is the “Right Ear.” And that is where we get paid.
The Fine Print I am a consultant, but I am not your financial advisor. The content on ChartDrifter is a personal log of my strategies and is strictly for educational and entertainment purposes. Never trade with money you cannot afford to lose.